Tuesday, December 23, 2008

Divergent Initiation of Transcription

Source: Core et al. (2008). Nascent RNA sequencing reveals widespread pausing and divergent initiation at human promoters. Science 322:1845-1848.

In the current issue of science (Vol. 322), two back-to-back articles are published both reporting divergent transcription close to TSS. The authors have used global run-on sequencing to determine the site, amount and orientation of active RNApols. One of their main finding is this divergence in transcription.
How is this helpful?
1. Transcription leads to chromatin modifications that may be essential for dynamic expression (see my previous post)
2. Transcription may expose the binding sites that are otherwise engaged in nucleosomes.
3. The resulting negative supercoiling may benefit transcription in the region.

Monday, December 15, 2008

Gene Expresion Regulation: Chromatin Remodelling

Source: Hirota et al. (2008). Stepwise chromatin remodelling by a cascade of transcription initiatoin of non-coding RNAs. Nature 456:130-134.

The RNA-seq strategy has revolutionized our way of doing biology, but it has also complicated the way we used to look at gene expression regulation. First, it has been shown that a huge number of RNAs are produced without ever being translated. Many of these species are envisioned to participate in some sort of expression regulation... In this paper, the authors make the case for one such mechanism: firing from upstream promoters results in chromatin modifications that leads to the activation of the main promoter.


While studying the regulation on fbp 1+ in yeast, the authors observed that upon starvation it takes around 60 min for the main RNA to show up; however, during this period 3 other longer RNAs show up suggesting active upstream promoters (a, b and c in figure below). Using chromatin-IP for RNApolII, they confirmed the occupation of these upstream promoters upon activation. They also assyed chromatin remodelling using MNase assay to show that the chromatin is in fact modified upon activation.
The key point here, however, was the fact that upon cloning a transcription termination site between the upstream promoters and the main promoter inhibits activation... which means transcription is required for the observed chromatin remodelling. The figure below, from the original paper, shows the details of this mechanism.

Friday, December 12, 2008

Correlating Transcription and Cell Cycle

Source: Klevecz, R.R., Bolen, J., Forrest, G., and Murray, D.B. A genomewide oscillation in transcription gates DNA replication and cell cycle. 2004. PNAS, 101(5): 1200-5

The authors measured transcript abundance as it fluctuated with changes in dissolved oxygen content for yeast. They found that there were three timepoints were gene expression peaked: two peaks with >2,000 genes reaching their maximum expression when oxygen levels were high (cells nonrespiring) and one peak where 650 genes reached their maximum expression when oxygen levels were low (cells respiring). Compared transcripts to states, and found that mitochondrial genes are expressed during reductive phase when mitochondrial function is minimal; while sulfur metabolism genes are expressed in respiratory phase right before they are needed for DNA replication in beginning of reductive phase. Most periods were ~40 minutes, and other studies showed that on a variety of media the doubling times of yeast were some multiple of 40 minutes.


•Other notes:
-cell-to-cell synchronization involved through respiratory inhibition by H2S and phase shifts due to acetaldehyde
-87% of genes expressed maximally in reductive phase
=2400 early, 2200 late
-650 genes maximum expression in oxidative phase
-4-12 minute lag between transcript peak and maximum gene product function
-DNA replication begins abruptly at end of respiration, H2S levels rise
-separation in time between oxidative and reductive phases goes to transcript levels and is coordinated with DNA replication
=prevents oxidative stress

Tuesday, December 2, 2008

Metabogenome: Discovering compounds a genes!

Source: Keurentjes, J.J.B., Fu, J., Ric de Vos, C.H., Lommen, A., Hall, R.D., Bino, R.J., van der Plas, L.H.W., Jansen, R.C., Vreugdenhil, D., and Koornneef, M. The genetics of plant metabolism. 2006. Nature Genetics, 38(7): 842-9

The authors used LC-QTOF MS to create metabolite profiles for two parental strains of Arabidopsis thaliana and 160 RIL descendants. They then genotyped these strains and ran QTL analysis on the >2000 metabolites they measured to come up with a staggering number of potential QTLs. Interestingly, a large number of compounds were not detected in either parent strain but only in the RILs. QTL hotspots were found and a study on a specific hotspot and its linked metabolites’ pathway carried out. This analysis was able to find the relative position in the pathway between two loci. Additionally, an analysis on a hotspot with unknown metabolites gave a set of metabolites to classify. Once discovered, the distinction in phenotypes revealed the presence of a previously unrealized enzyme in one of the parents. The authors close by stating that pathway elucidation and identification are possible through this high-throughput analysis, as well as metabolite grouping for identification.

Other notes:
-75% of compounds were assigned a QTL
-853 of 2129 metabolites not detected in either parent
-QTL for 1592 metabolites, roughly 2 QTLs per compound
-all AOP-related metabolites also map to MAM, while few MAM-metabolites map to AOP suggests AOP is downstream of MAM
-correlation between masses were calculated based on QTL profiles: vectors of P-values associated with markers
-co-occurrence of well-known or unknown metabolites may reveal pathway information

Monday, December 1, 2008

Yeast Epistasis Map

Source: Roguev et al (2008). Conservation and Rewiring of Functional Modules Revealed by an Epistasis Map in Fission Yeast. Science 322:405.

Epistasis analysis is one of the most direct methods for defining functional relationships between genes and proteins. These interactions can be negative (synthetic lethality) or positive (suppression). Whole-genome high-throughput epistatic maps (E-MAP) were peviously published for S. cerevisiae; here, the authors focus on S. pombe. E-MAPs are generated through generating pairwise knock-outs and assaying their henotypes (usually growth in complex media), comparing them to the single-gene mutants. This E-map includes ~118,000 double mutants in 550 genes invloved in different aspects of cellular processes. In this set, similar to previous E-MAPs, the correlation between protein-protein interactions (PPI) and epistasis scores is apparent (see the figure below from the original paper).

The authors have also focused a great deal on dissecting the RNAi machinery in S. pombe. This study resulted in the identification of a novel component in this machinary (rsh1).

Thursday, November 6, 2008

Out with the old, in with the new : Allele Replacement

Source: Gray, M., Piccirillo, S., and Honigberg, S.M. Two-step method for constructing unmarked insertions, deletions and allele substitutions in the yeast genome. 2005. FEMS Microbiology Letters, 248: 31-6

In the spirit of the recent election, I decided to focus on a paper about change.

The authors developed a two-step process for removing, inserting or replacing regions in the yeast genome. They first remove the gene in question, replacing it with URA3. This is possible by flanking the URA3 with sequences homologous to the sequences flanking the gene in question. Due to recombination, URA3 is inserted in place of the gene. Selection for this occurs by growing cells on media lacking uracil ("Yes We Can...complete pyrimidine synthesis!"). The next step involves taking the replacement gene and flanking it with the same homologous sequences. Again, recombination replaces URA3 with this new insertion through recombination. Selection for this occurs by growing cells on media containing uracil and 5-FOA, a chemical that mimics uracil but is toxic. If a cell still has URA3 it will attempt to metabolize 5-FOA and kill itself. This method can be used to insert a new sequence (flankers originally touch), delete a sequence (URA3 replacement is just touching flankers), or replace a sequence. To insure replacement worked, primers from the replacing strand may contain a point mutation so that PCR would not amplify the inserted sequence and a gel-run would fail to show any DNA. Sequencing is always necessary to confirm due to the likelihood that any URA gene may mutate between functionality and pointless at any stage.

Friday, October 31, 2008

Imperfect Phenotypes: Transcripts and Peptides

Source: Ghaemmaghami, S., Huh, W., Bower, K., Howson, R.W., Belle, A., Dephoure, N., O’Shea, E.K., and Welssman, J.S. Global analysis of protein expression in yeast. 2003. Nature, 425:737-41

The authors created a library of strains with TAP-tagged to an ORF. They then could use a single antibody on each strain in mid-log phase to quantify the protein abundance. Comparing these values to those for complementary transcript abundance (via microarrays) and to codon bias scores, they found that there is a significant level of correlation between the measurements. Average transcript-to-protein ratio is fairly consistent near 4,000 proteins per transcript across the range of transcripts, but the protein variability for genes with the same transcript abundance was quite high. Codon bias had a similar good ratio, with high levels of variability at the same codon score. This variation was determined not to be measurement error, as a case of 206 essential proteins were retested on the TAP-tagged library in triplicate. The TAP library was able to detect a greater number of proteins than typical LC/MS methods, due to LC/MS high abundance bias.

So once again, we find that transcript differences aren't the best proxy for understanding cellular changes in response to perturbations. They may point in the right direction but a 10-fold change in one transcript and a 5-fold in another may result in the same peptide number difference. But are proteins any better, what with post-translational modifications and activations? While it is not as common place to measure proteome changes, I'm already thinking we may need to start looking into phosphorylome (?) changes to tie it all together and get a genuine comprehensive view.

Other notes:
-80% of proteome is expressed during normal growth conditions
-tandem affinity purification (TAP) tag is colmodulin binding peptide, TEV cleavage site, two IgG binding domains
-successful integrants for 98% of all ORFs in S. cerevisiae
-tagging does not hinder, TAP can be degraded
-detected 79% of essential, 83% of products corresponding to assigned gene names
=73% of all annotated ORFs
-very abundant mRNAs generally encode for abundant proteins
=some variation due to TAP tag, as subset that was retested had higher correlation than initially found
-similar, but lower, correlation between protein abundance and codon usage as measured by codon adaptation index (CAI)
=just noise at CAI < 0.2

Tuesday, October 28, 2008

Transcripts and Peptides: On-again, Off-again

Source: Foss, E.J., Radulovic, D., Shaffer, S.A., Ruderfer, D.M., Bedalov, A., Goodlett, D.R., and Kruglyak, L. Genetic basis of proteome variation in yeast. 2007. Nature Genetics, 39(11):1369-75

The authors used a mass spectrometry approach coupled with retention time shift software to measure the peptide abundances between the BY and RM strains and their segregants. Replicating a sample via quantitative western blot they found that they could reliably measure peptides as a quantitative trait, and that the levels showed inheritance patterns similar to transcript data from a previous study. A number of peptide levels differ significantly between the two parents and a linkage analysis found four major hotspots responsible for many of these linkages. Two of these hotspots were enriched for peptide synthesis, one being on LEU2, the other two were not enriched for any particular term. Almost all the peptides showed trans linkage. Only three of the four hotspots overlap to hotspots generated by transcript data of the 278 measurable peptides, and only rarely do these hotspots link to both a peptide and its corresponding transcripts. Interestingly, the 278 transcripts find the same hotspots as the total transcript database, suggesting a limited number of polymorphism control the whole proteome, thus the small sample size of proteins may still find the proteome hotspots.

•Other notes:
-weak correlation between transcript and peptide levels, suggesting post-transcriptional regulation acts as a buffer
-BY and RM differ at ~0.6% of genome
-if a representative sample this means 1/3 of all proteins differ between BY and RM
-221 peptides for 278 proteins
-heritability average was 62%
-expanded to 0.17 to get 85 proteins, 109 linkages
=only 7% of peptides map to a marker within 20kb of their ORF
-average correlation between protein and transcript abundance is 0.186
-3 of 4 hotspots overlap
=shared hotspots do not always overlap the same gene’s transcript and protein
=same polymorphism causes changes at different stages for different genes

Monday, October 20, 2008

The Age of Sequencing I: The Sanger Alliance

Source: Shendure and Ji (2008). Next-generation DNA sequencing. Nature Biotech 26:1135-1145.

There is no doubt that Sanger biochemistry (i.e. 'cycle sequencing') has set the fundamentals of sequencing; both in high-throughput clone based methods (e.g. shotgun) and single PCR product targeted sequenicng. In each cycle, labeled ddNTP molecules mark a single nucleotide at its end and through high-resolution electrophoretic separation, the final sequence is read. Each reaction can read about ~1000 bp, with the max accuracy of 99.999% and the cost of $0.5 per kb in shotgun.

This platform has been used for the emergence of the second generation sequencing pipelines: 454, Solexa, SOLiD, Polonator and HeliScope. These methods, despite many differences in their methodologies, follow the same 'cycling' logic followed by an optical signal of some sort. Library preparation, followed by adapter ligation and amplification is the first step of all these methods. Amplification is done either through in situ polonies, emulsion PCR or bridge PCR. The amplification step, however, should ensure the spacial clustering of each clone.

The bottom line is, these methods bypass the steps that are required in classic Sanger method and also use array-based approaches to enforce parallelism.

Saturday, October 11, 2008

Discovering Species-level Functions in Complex Microbial Communities

Source: Kalyuzhnaya et al. (2008). High-resolution metagenomics targets specific functional types in complex microbial communities. Nature Biotrech 26 (9): 1029-1034.

Environmental genomics (metagenomics) has become a hot topic in molecular biology; however, it is costly and highly dependent on the number of reference genomes available. Thus, studying highly complex communities like those of soil or lake sediments are not currently feasible. In this study, the authors use a labeling method to target the species that are specific for a given function. In this case, they have studied methylotrophy and through the usage of labled methane, methanol, methylamine, formaldehyde and formate, they have focused on the species directly assimilating these substrates through extracting the labeled fraction of the genomic DNA extracted from the community (using isopycnic centrifugation).

The 16S rRNA analysis shows that the samples enriched for methylotrophy are way less complex than the initial sample largely including the bona fide methylotrophs: Methylobacter tundripaludum, Methylomonas sp., Methylotenera mobilis, Methyloversatilis universalis, Ralstonia eutropha. It should be noted that some of the enriched species may not be methylotrophs but rather secondary links in the food chain (e.g. using 13C-CO2 produced by methylotrophs).

The authors demonstrate the utility of their approach through identifying a novel methylotroph and reconstructiong its genome and metabolic network.

Tuesday, October 7, 2008

Replication Fork vs Choice of Origin

Source: Courbet et al. 2008. Replication fork movement sets chromatin loop size and origin choice in mammalian cells. 

The stability of the genomes relies on a faithful single round of replication. The ORC has been extensively studied but the question we need to address is the spacial distribution of origins. The authors here show that slowing down the replication fork results in the recruitment of latent origins that are not normally used. The "slow" phenotype was the result of depleted nucleotide pools and addition of A+T to the cell culture restores the "fast" phenotype. Using aphidicolin, a drug which targets DNA pol, the authors established the fact that it is replication fork movement and not nucleotide pool sizes that drives the observed phenomenon.

Now, in a "slow" background, restoring "fastness" by addition of A+T results in two steps: First, 30% of the origins would not fire; second, in the next S phase the pattern mimics that of "fast" cells.

The Metabolome as Phenotype

Source: Fiehn, O., Kopka, J., Dormann, P., Altmann, T., Trethewey, R.N., and Willmitzer, L. Metabolite profiling for plant functional genomics. 2000. Nature Biotechnology, 18: 1157 – 61

The authors grew up three strains of Arabidopsis: one wild-type, one with a DGD mutation, and one with a stomatal density mutation. They used GC/MS to profile the strains with 300+ metabolites in an unbiased approach that picked up a number of unknown molecules. Nearly 60 compounds were found to be significantly different between wt and the DGD mutation. The authors used an unbiased approach and found that a number of unidentified compounds were also noticeably different. Each strain has a unique metabolic profile, as determined through principal component analysis.


Significant ( p < 0.01) metabolite differences, between dgd and wt, sdd1-1 and wt. Known or high-fold different metabolites shown.

Other notes:
-used internal standards for correcting and as normalization
-also normalized to 1 mg plant leaf fresh weight
-testing reproducibility in samples that were measured multiple times found deviations for same day analysis at 8 +/- 6% over 149 polar compounds
-tested biological variability and found it in clear excess of preparation variability, averaging 40%
-single gene change showed 153 of 326 significant differences in metabolites

“This analysis demonstrates the power of the metabolite profiling method to identify and quantify previously overlooked alterations, following a more comprehensive interpretation of the consequences of genetic modifications.”

Monday, September 29, 2008

Profiling the Killer: Targeting Pancreatic Carcinomas

Source: Jones et al. (2008). Core Signaling Pathways in Human Pancreatic Cancers Revealed by Global Genomic Analyses. Science 321:1801-06.

An annual estimate of ~200,000 patients inflicted by pancreatic cancer with a mortality rate of ~100% makes this specific type of cancer quite a challenge. The authors use almost all of the modern techniques available to them to detail the cellular state of this cancer type. They sequenced the coding genome of 24 patients and identified 1562 somatic mutations (25.5% synonymous, 62.4% missense, 3.8% nonsense, 5.0% small indels,
and 3.3% splice sites or within UTRs). Of the 20,661 genes analyzed by sequencing, 1327 had at least one mutation, and 148 had two or more mutations. The authors then structurally modelled 404 of the missense mutations, where 55 of them were close to an important interface and likely to affect protein function. In general, the average number of mutations in these tumors  (77) are considerably lower than that of say breast cancer (101), possibly denoting fewer generations after tumorigensis.

Then, using SNP arrays the authors mapped genetic deletions or amplifications. Then they combined these data plus mutations plus gene-expression profiles to find key proteins in the emergence of this tumor. These analyses identified 69 gene sets that were genetically altered in the majority of the 24 cancers examined. 31 of these sets could be further grouped into 12 core signaling pathways including KRAS and TGF-b.

Tuesday, September 23, 2008

Classifying the Stem Cell Repertoire

Source: Muller et al (2008). Regulatory networks define phenotypic classes of human stem cell lines. Nature 455:401-405.

Before this study no systematic approach for the classification of stem cells and their pluripotency capacities was introduced. The authors in this paper employ gene expression profiling as a generic method for such classifications. They generate a "stem cell matrix" in which many different types of stem cells are profiled along side differentiated tissues as controls. Subsequently, they use machine learning approaches for an unsupervised clustering of the cell lines based on their expression profiles. 12 distinct classes were identified... While a number of pluripotent stem cells (PSC) were grouped in specific clusters, some like neural stem cells are distributed in all classes. Then, they used an additional 66 profiles as a cross validation phase.

In the end, they use GSEA and MATISSE algorithm to find the pathways and regulatory networks that are associated with different phenotypes in their stem cell matrix.

Monday, September 15, 2008

Mapping Diabetes to a Compound, Gene

Source: Dumas, M-E., Wilder, S.P., Bihoruea, M-T., Barton, R.H., Fearnside, J.F., Argoud, K., D’Amato, L., Wallis, R.H., Blancher, C., Keun, H.C., Baunsgaard, D., Scott, J., Sidelmann, U.G., Nicholson, J.K., and Gauguier, D. Direct quantitative trait locus mapping of mammalian metabolic phenotypes in diabetic and normoglycemic rat models. 2007. Nature Genetics, 39 (5): 666-72

The authors took three mouse lines and did an unbiased NMR metabonomics approach, two of these lines were diabetic. They then used both R/qtl and QTL Reaper to map NMR compounds among offspring of crosses within these strains. After identifying a number of candidate loci that matched both mapping methods, the authors used NMR to identify a molecule that had mapped (benzoate). They then used cognate mouse lines (essentially allele-replaced mice) to test phenotypic response for a region that had shown up from both forms of QTL mapping and also had substantial transcript abundance differences between the lines. The authors found that the cognate strains explained a large amount of the difference for benzoate, but also for a number of other metabolites that were related to the pathway. This was an excellent study in using QTL to identify controlling loci in metabolism, discover the compound, and observe the allelic affect.

Other notes:
-only 110 consistent linkages
-Bonferroni corrected reduced to 22 significant peaks
-mQTLs were less abundant than eQTLs
-Noticed multiple loci linked to same metabolite, suggests polygenic control
=found epigenetic effects

Friday, September 12, 2008

Transcripts are not perfect markers of change

Source: Daran-Lapujade, P., Jansen, M.L.A., Daran, J., van Gulik, W., de Winde, J.H., and Pronk, J.T. Role of transcriptional regulation in controlling fluxes in central carbon metabolism of Saccharomyces cerevisiae. 2004. Journal of Biological Chemistry, 279(10): 9125-38

The authors grew yeast in chemostats under carbon-limitation on one of four carbon sources: glucose, maltose, acetate, and ethanol. They used flux balance analysis to come up with metabolic fluxes through key proteins and also measured transcript abundances across the genome for all four conditions. They found that there was not a great difference found (as compared to Kresnowati et al) except in 117 transcripts, between fermentable sugars and C2-carbon sources, though fluxes differed significantly at many steps in carbon metabolism. The difference between maltose and glucose was limited mainly to maltose transporters, both in flux and transcript abundance. Similarly, there was not a great difference between acetate and ethanol. Looking at the transcript abundance, the authors saw that the 117 transcript profiles clustered into six clusters relating to difference between glucose/maltose and acetate/ethanol, as well as within the carbon sources (ie, between glucose and maltose), the expected genes were in the expected clusters. Looking at the MIPS classification of the genes, 40% are still unknown, while 29% relate to carbon metabolism. The authors then looked at the upstream sequences for clustered genes, discovering conserved sequences for transcription factors. Of these transcription factors a few were predicted while unknown factors seem to play a role in more. Noting the discrepancy between changes in flux and changes in transcript abundance, even the magnitude changes, the authors suggest that most carbon-metabolism is altered via post-transcriptional regulation, and that transcript regulation is only used for rate-limiting steps in pathways. Finally, the authors hypothesize reasons their changed transcript dataset is so small compared to others who have looked at carbon source change and suggest it is due to the chemostat. The authors strongly feel the chemostat keeps a more constant environment, allowing changes to single perturbations, as opposed to stress, growth, and overabundance that is seen in batch.

Other notes:
-180 total transcripts change in response to carbon source
=33 between glucose and maltose
=16 between ethanol and acetate
=117 between sugars and C2-compounds
-complete data set found at www.bt.tudelft.nl/carbon-source
-maltose uptake requires energy-dependent proton-symport mechanism as opposed to glucose’s simple diffusion
-biomass yields for C2 lower due, respiration rates higher due to lower ATP yield
-higher fluxes in TCA, glyoxylate cycle, gluconeogenesis for C2
-lower fluxes in glycolysis, oxidative-PPP, NADP-dependent acetaldehyde and/or isocitrate dehydrogenases for C2
-79 upregulated, 38 downregulated in cultures limited by C2
=79 : 21 carbon metabolism, 7 for TCA, 5 acetyl-CoA metabolism and trafficking, 3 transcriptional regulation, 8 for transport, 7 for nitrogen metabolism and transport (SAM3), only 1 in respiration
=38 : 20 no clear role, 10 carbon metabolism, 4 PPP, 3 transport, 1 signaling
-previous studies on diauxic shift 400 transcripts shown to change 2-fold, 600 in glucose vs ethanol in batch
=225 genes are transcriptionally regulated by glucose, but not in glucose-limited chemostat with low glucose concentrations
=acetate as a byproduct for glucose batch, alters pH gradient, causes stress response
-in chemostat glucose is too low to encourage ethanol/acetate production
=growth rate decreases in batch, held steady in chemostat
-magnitude of changes does not match up, requires more than transcription regulation
=glycolysis and pyruvate showed no correlation
=“during carbon-limited cultivation, fluxes through these central metabolic pathways in S. cerevisiae are not primarily controlled at the transcriptional level”
=DNA microarrays “have limited value as indicators for in vivo activity for proteins”


Metabolites at right, transcript at left; significant decreases between carbon sources underlined, increases highlighted. Many more metabolites differ significantly than their corresponding enzyme's transcript, and magnitudes rarely match!


This has been a pet peeve of mine for a while: the multitude of studies that do some experiment, slap a microarray around and claim: "Aha! Look how many genes change! THIS is quite important!" Research should mature to look deeper at phenotypes: proteomics and metabolomics come to mind. Plus, this opens up a huge field of importance for genomicists: post-transcriptional regulation.

Wednesday, September 10, 2008

Transcription Initiation: Can It Get Any More Complex?

Source: Revyakin et al. (2006). Abortive Initiation and Productive Initiation by RNA Polymerase Involve DNA Scrunching. Science 314:1139-1143.

Transcription initiation involves a number of steps:
1. Attachment to the
 promoter (clodes complex: RPc).
2. Unwinding the DNA ~1 turn to form the open complex (RPo).
3. Synthesis and release of short RNAs (RPitc).
4. Promoter escape and elongation.

The most complex is RPitc in which short RNA transcription is ocurring (~8-11 nt); however, RNA polymerase is not moving as determined by footprinting assays. There have been three models for explaining this behavior:
1. Scrunching: DNA is contracted inward.
2. inchworming: RNA pol is conformationally expanded.
3. transient excursions: RNA pol moves back and forth with long intervals.

If the first model is true, at RPitc stage the DNA is being unwound. The authors have made an experimental setup for detecting these variations (see below) and they use this system to show that this model is correct.

Red rover, red rover, send your genes on over!

Source: Coop, G., Wen, X., Ober, C., Pritchard, J.K., and Przeworksi, M. High-resolution mapping of crossovers reveals extensive variation in fine-scale recombination patterns among humans. 2008. Science, 319: 1395-8

The authors looked at the number of recombination events and found a difference in both the number and, to a lesser extent, location of crossovers in males and females. The authors looked at a small population of humans using a chip to look for SNP haplotypes in nuclear families with multiple children. Hotspots account for most crossover events in both sexes, while some hotspots seem reserved more for one sex versus the other. Heritability was not high, but was significantly different from zero to demonstrate heritability of hotspot usage.

Other notes:
-mothers with higher recombination rates have slightly more offspring
-viable offspring of older mothers tend to have higher recombination rates
-recombination rates go up with gene density
-recombination rates reduce near genes, highest at a distance away from start of genes


Recombination rate vs Distance from Transcriptional Start Site

Tuesday, September 9, 2008

How come nothing in science is ever "normal"?

Source: Callister, S.J., Barry, R.C., Adkins, J.N., Johnson, E.T., Qian, W., Webb-Robertson, B-J.M., Smith, R.D., and Lipton, M.S. Normalization approaches for removing systematic biases associated with mass spectrometry and label-free proteomics. 2006. Journal of Proteome Research, 5(2):277-86

The authors examine four methods of normalization to remove variability: Central tendency (centers around a mean, targets bias independent of magnitude), linear regression (centers around least squares line, targets bias linearly dependent on magnitude), local regression (linear regression for subset), and quantile (sets all samples to same distribution). Before normalization, the datasets (standard protein compilation, Deinococcus radiodurans, and brain tissue from methamphetamine-dosed mice) did not overlap, but all forms of normalization removed large amounts of variation and resulted in overlap between samples. No one form of normalization was consistently best at removing variation, all but local regression were found to be best at some sets. Linear regression seems a good method to start with, though quantile resulted in the largest percent reduction in pooled variation across all replicates. In terms of coefficient of variance (also known as RSD), central tendency was consistently the largest improvement. Quantile is the most likely the best though, since it does not assume that the mean peptide ratio is equal to zero (which would be true if all peptides were measured, but due to the nature of MS is false).

• Other notes:
-all data first log transformed to make more symmetric
-all data plotted in an M vs A plot (minus vs average)
=“minus” : ratio, mi = log2(xi, j=1 / xi, j=2)
=“average” : intensity, ai = log2(xi,j=1 * xi,j=2) / 2
=xi,j is abundance of peptide i in sample j
-Central tendency normalization: normalized relative abundance ratio m’i = mi – μ, where μ is the arithmetic mean of the population of peptide abundance ratios
-Linear regression normalization: applying least squares regression to the scatter plot: m’i = mi – m*i where m*i is the predicted peptide ratio calculated from the regression equation
-Local regression normalization: linear regression on certain areas, mainly exterior where abundance approaches saturation or background
-Quantile normalization: assumes distribution of abundances is expected to be similar
1) assign each sample to a column, each compound to a row
2) index each peptide abundance in column
3) sort column by peptide abundance
4) replace each abundance within a row by that row’s mean
5) restore original order by index from (2)


Replicate peptide levels for (left) un-normalized, (center) quantile normalized, and (right) central tendency normalized data.

Monday, September 8, 2008

Extrinsic Stochastic Variations in Gene Expression

Source: Volfson et al. (2006). Origins of extrinsic variability in eukaryotic gene expression. Nature 439:861-864.

Stochastic variation in gene expression across a clonal population has been observed. These variation are classifies as either intrinsic or extrinsic variation. Intrinsic phenomona result from the inherent noise in the regulatory element that control a given gene; whereas, extrinsic variations are caused by more global or environmental stochastic processes.

To address extrinsic variation, the authors make yeast strains with 1, 2 ... 5 gal'-GFP copies. Then they use FACS machines to measure th expression of GFP in each cell. They sh
ow that, on average, GFP expression normalized by copy number is similar in all strains, denoting that the system is not saturated. Then, they hypothesize that intrinsic and extrinsic variation can be distinguished as intrinsic variation affects only one copy; whereas, extrinsic variations affect all the copies simultaneuously. In other words, if the variations are completely intrinsic then the standard deviation divided by the mean i
s proportional to the square root of copy numbers; while, if all the variation are caused by extrinsic factors this value should be independent of copy number.


The Gal system used by the authors largely falls into the second category. The authors then go on to model and validate their observations that falls outside the scope of this summary and I encourage those who are interested to read the original paper.

Thursday, September 4, 2008

miRNAs as Global Regulators: How Global Are We Talking Here?

Source: Selbach et al (2008). Widespread changes in protein synthesis induced by microRNAs. Nature 455:58-63.

miRNAs comprise a major set of post-transcriptional regulators with profound effects on different cellular processes through gene expression regulation. This paper is the first of its kind to monitor the large-sclae effects of deregulations in miRNA expression. Despite their apparent importance, we know little about the depth of regulation by miRNAs. Are there any miRNA master-regulators? How many gene on average are regulated by these small RNAs?

In this paper, the authors use state-of-the-art technologies to detect and compare protein levels in the absence, presence or over-expression of certain miRNAs. In their setup, they start with miRNA transfection into HeLa cells. 8hr post-infection, they label the transfected cells with heavy isotopes of amino acids while using medium-heavy for control samples. They combine the samples and through comparing the heavy to medium-heavy ratio from the mass-spectra, they comment on the abundance of the proteins.


They first show that the mRNAs downregulated in the presence of excessive miRNAs are enriched in the target seed. They subsequently make predictions about which mRNAs are directly targeted by each miRNA.

The take home message from this paper is the fact that the miRNAs affect a large spectrum of proteins... much higher than what we imagined before. For example, the authors show that let-7 regulates the expression of thousands of proteins in the cell.

Friday, August 29, 2008

The Next Locus is Always Harder

Source: Brem, R.B., Storey, J.D., Whittle, J., and Kruglyak, L. Genetic interactions between polymorphisms that affect gene expression in yeast. 2005. Nature, 436(7051): 701-3

The authors took the transcript data for yeast and searched for interacting loci. They found that the best approach was to search for primary loci, then separate segregants based on allele inherited at that locus and search jointly for another locus. Using this approach, they found that not a large amount of transcripts had detectable interactions and those that did were isolated. One hotspot did appear for loci-pairs, the MAT-GPA relation, these genes are involved in mating type and pheromone response respectively. They used this hotspot to test their interaction theory, creating four engineered strains with the combination of alleles, but identical background, and comparing them to similar-genotyped segregants, finding that most of the phenotypes had parallel responses.

•Other notes:
-identified locus pairings for 225 transcripts
-65% had interaction based on model and FDR
•test on 547 transcripts with two independent loci showed only 13% interacting
-only 33% of secondary loci would have been picked up in a genome scan originally
-hypothesize that half of transcripts are controlled by multiple genetic interactions but that at least one partner has effects too low for mapping


Dual-linking transcripts are plotted in 2-D, with their primary linkage locus on the x-axis, and their secondary on the y-axis. Circles are proportional (in misleading width, NOT area) by the number of transcripts in each 2-D bin. The largest is the GPA-MAT region.

Thursday, August 28, 2008

Small Phenotypes - Large Number of Loci

Source: Brem, R.B. and Kruglyak, L. The landscape of genetic complexity across 5,700 gene expression traits in yeast. 2005. PNAS, 102 (5): 1572-7

The authors measured transcript abundance between BY4716 and RM11-1a yeast strains as well as their segregants to do QTL mapping. Over half the transcripts linked to a QTL, but extensive modeling showed that most traits would have multiple loci and no single locus would have a large effect. The authors limited the transcripts they looked at based on heritability scores. They also did a breakdown of inheritance patterns for the phenotypes and concluded that an overwhelming proportion are inherited in a transgressive segregation manner as compared to an additive effect. A small but nontrivial were found to be epistatically inherited, and most were in the transgressive segregation camp.

Other notes:
-median heritability was 27%
-no QTLs detected for nearly 40% of highly heritable transcripts
-only 3% of highly heritable transcripts have single-locus inheritance, 17-18% for one or two loci, over half for at least five loci
-11% had directional model (phenotype of one parent)
-59% were transgressive segregation (outside parental range)
-16% epistatic (tests difference between means of segregants and parents)
-“opposing QTLs may be a mechanism for generating diversity in subsequent generations”


Left: Directional; Center: Transgressive; Right: Epistatic


Damn you genetic complexity!

Wednesday, August 27, 2008

Discovering microRNA–target RNA pairs

Source: German et al. (2008). Global identification of microRNA–target RNA pairs by parallel analysis of RNA ends. Nature Biotech 26:941-946.

The authors have introduced a great method for identifying miRNA target sites through sequencing the 3' cleavage fragments and finding their potential miRNAs. The schematics of their method is shown below where they ligate a linker to the 3' cleavage fragments. Normal mRNAs would not be ligated due to the presence of a cap or lack of 5' phosphate. They subsequently amplify and sequence the ligated fragments. Their library has a great coverage and encompasses ~90% of the orfs in yeast. Their method captures 98 out 100 known miRNA target sites in arabidopsis. This batch of sequenced target sites were then used to identify the corresponding miRNA. They validate a set of their prediction which seems to work fine.

Tuesday, August 26, 2008

Good-bye stress response

Source: Brauer, M.J., Huttenhower, C., Airoldi, E.M., Rosenstein, R., Matese, J.C., Gresham, D., Boer, V.M., Troyanskaya, O.G., and Botstein, D. Coordination of growth rate, cell cycle, stress response, and metabolic activity in yeast. 2008. Molecular Biology of the Cell, 19: 352-67

The authors ran 36 samples (6 growth rates on 6 nutrient limitations, including two auxotrophs) and measured global transcript levels at and steady-stage growth. They looked to see if gene expression could be a linearly correlated with growth rate and found that for 27% of genes, this appeared to be the case. Auxotrophs limited for phosphate or nitrogen showed cell arrest and normal levels of glucose and ethanol in the media, but when limited for their auxotrophy showed high fermentation with greatly enhanced levels of ethanol present. The authors hypothesize that there are two metabolic controls: one that’s independent of nutrient type, limits based on cell growth without full arrest while the other senses a natural nutrient starvation and fully arrests the cell. The authors also compare their gene sets of positively and negatively correlated genes to gene sets from stress response, cell cycle periodicity and yeast metabolic cycle periodicity. They find that most of the genes positively correlated with growth rate are found in stress repressed conditions and mitochondrial and cytosolic ribosome clusters from YMC. While genes negatively correlated to growth rate are found in stress induced and peroxisomal clusters from YMC. They suggest that these genes are mainly responding to instantaneous growth rates and not the particular condition tested. Building a model off this presumption, they are able to more-or-less recreate the growth rate from transcript data from Brauer et al 2005 involving the diauxic shift. Much of their significance for whether a gene is positively or negatively-correlated with growth comes from bootstrapping.


Figure 5. Transcriptional response of stress-related and cell cycle-related genes to changes in growth rate. x-axis: Slope of transcript abudance vs growth. Genes expressed periodically during the cell cycle (black line; Spellman et al., 1998) are distributed essentially as background, whereas genes induced (red line) or repressed (green line) by stress (Gasch et al., 2000) tend to be conversely repressed or induced as growth rate increases.

• Other notes:
-positively-correlated genes are enriched for ribosomal proteins
-auxotrophs don’t arrest when lacking their auxotrophic nutrient, but do when lacking a natural nutrient; also consume twice as much glucose
-5537 genes measured, 3049 fit linear model with growth rate, 1470 respond significantly to growth rate
-can play with sets of genes at http://growthrate.princeton.edu
=GO enrichment – negative: energy metabolism, oxidative metabolism, oxioreductase activity, peroxisome
=positive: mitochondrial protein import, translation, ribosome biogenesis, rRNA metabolism
-ESR genes may be responding not to stress but to instantaneous growth rate
-cell-cycle genes had same distribution as total gene set
=only M-G1 phase was slightly enriched for negative correlation with growth rate
•slower growing cells spend more time waiting for division signal
-yeast grown in batch on poorer nutrient sources had better stress response
=this supports the theory that ESR-induced genes are just slow-rate genes, these cells were already growing slowly so they did not change as dramatically

Although I find it intriguing to think that transcript abundance is more a response to growth rate than stress, I find some problems with that interpretation. Slower growing cells, goes the hypothesis, will respond better to stress since they already have the right transcript profile. BUT, slower growing cells spend a greater proportion of their life in G1 and G2, the energy-producing stages. This means they are already subject to more stress per cell cycle, and thus that is the reason the Stress/Slow Growth profile is already up. In the end, maybe it's semantics unless we can start to find stress-specific profiles.

Monday, August 25, 2008

How harmful are amino acid changes?

Source: Boyko, A.R., Williamson, S.H., Indap, A.R., Degenhardt, J.D., Hernandez, R.D., Lohmueller, K.E., Adams, M.D., Schmidt, S., Sninsky, J.J., Sunyaev, S.R., White, T.J., Nielsen, R., Clark, A.G., and Bustamante, C.D. Assessing the evolutionary impact of amino acid mutations in the human genome. 2008. PLoS Genetics, 4(5):e1000083

Its well-known that amino acids aren't necessarily well-conserved in homologous proteins, but function will remain. Obviously some amino acids can easily substitute in for others to fulfill some structure or charge function. So what happens when a SNP comes along and alter an amino acid? Usually, nothing, or at most a slight decrease in stability.

The authors scanned the human genome of a small sample of African and European Americans, looking for SNPs, allele frequency, and the amount of change each SNP may cause. They found that many nonsynonymous mutations are neutral (27-29%), a large amount are slightly deleterious (30-42%), and the rest are highly deleterious or lethal. Most of the highly deleterious alleles were present in alleles that were less than 5% of sampled alleles at that locus. Additionally, the cumulative affect of benign mutations greatly outweighed the effect of harmful mutations. The affect of SNPs was measured using PolyPhen, a program that characterized the SNP as benign, possibly damaging, and probably damaging based on its conservation and amino acid change; ‘damaging’ only referring to protein structure not organisms’ fitness. Furthermore, comparing to an outgroup of chimpanzees, 10-20% of SNPs were deemed fixed by positive selection.


Allele frequency on x-axis

Red: strongly deleterious
Orange: moderately
Yellow: weakly
Green: nearly neutral
Blue: neutral
White: beneficial

Other notes:
-around half of nonsynonymous mutations are strongly or mildly deleterious
-most segregating variation above 5% frequency in the population is predicted to be nearly neutral, with higher proportion of neutral variation as the allele frequency increases
-15,916 benign; 4,199 possibly damaging; 2,646 probably damaging SNPs from PolyPhen
-estimated 5% of benign, 27% of possibly, and 35% of probably damaging were fixed through positive selection

Thursday, August 21, 2008

RNA-Seq: Deep Sequencing the Human Transcriptome

Source: Sultan et al. (2008). A Global View of Gene Activity and Alternative Splicing by Deep Sequencing of the Human Transcriptome. Science 321:956-960.

Apparently, we're going back to re-doing all the experiments that we once did using tiling arrays. These papers are far from innovative but I think it's good for the people in the field to know that this data is out there (hence supporing its publication in science). Apart from expensive reactions, tiling arrays also miss vital information like splice sites and alternative splicing. RNA-seq circumvents most of the problems inherent to other methods and the authors have used this approach to provide snapshots of hum
an transcriptome at the nucleotide level. The authors do many controls to validate their results. For example, they compare the reads for each gene to PolII Chip-seq data to make the case that the number of reads is a good measure for expression. The figure below (from the original paper) shows the distribution of PolII Chip-seq reads for the genes with different levels of expression (the x-asis is the position relative to TSS).


Their results generally include the identification 25% more genes and ~100, 000 splice sites (compared to ~4000 known before). They also show that exon skipping is the most prevalent method of splicing.

Metabolic Flux and Sequence Conservation

Source: Bilu, Y., Shlomi, T., Barkai, N., and Ruppin, E. Conservation of expression and sequence of metabolic genes is reflected by activity across metabolic states. 2006. PLoS Computational Biology, 2(8):e106

The authors use flux balance analysis (FBA) to create an optimal solution set for metabolic genes in various media conditions. They then compare the flux in this set for individual reactions to evolution rate of the protein-coding region, promoter, and expression levels. The authors found rough correlation in the expected manner: lower flux variability genes show higher conservation across species. Additionally, genes found to be active throughout different media conditions were found to be well conserved.

Other notes
-in FBA’s optimal solution space there are missing constraints to the model, though it has been shown that models still carry meaningful biological info
-flux values show moderate, statistically significant correlation with corresponding gene expression levels and protein abundance
-flux variability analysis: difference between max and min flux values in the space of optimal flux distributions for each reaction
-expression divergence score: expression patterns among four yeast strains
-promoter conservation score: based on three yeast species’ conservation of S. cerevisiae transcription factor binding sites
-moderate, statistically significant correlation between flexibility scores and expression divergence score, promoter conservation score
-possible that high flexibility score means the genes are in pathways that have alternatives
-of the 50 genes with highest flex score, 6% are essential, whereas 17% of the 89 zero-flex genes are essential
-statistically significant correlation between knockout growth rate (For metabolic genes) and evolutionary rate
-best predictor for evolutionary rate is the expression level of the encoded gene
-“Previous studies suggest that the predicted variability in metabolic states may represent heterogeneous metabolic behaviors of individuals within a cell population”


I found this study short and sweet. A simple question: Do highly conserved genes have more rigid optimum activities? So for enzymes that are not metabolically constrained we see a greater diversity in sequence. This makes senses, mess with the choke-points and you screw up a pathway, tinker with some of the non rate-limiting genes and there isn't as much a problem.

Tuesday, August 19, 2008

Liquid Chromatography : A Pivotal First Step in Compound Measurement

Source: Bajad, S.U., Lu, W., Kimball, E.H., Yuan, J., Peterson, C., and Rabinowitz, J.D. (2006) Separation and quantitation of water soluble cellular metabolites by hydrophilic interaction chromatography-tandem mass spectrometry. Journal of Chromatography A, 1125, 76 – 88.

My labmates tried a number of different columns in a number of different conditions to settle on HILIC with amino column at pH of 9 for best results. They did this testing a number of spiked in compounds and using a derived scoring method to analyze peak ‘goodness.’ After settling on this, they discovered retention times to improve the scan method and were able to quantitate over 100 metabolites. They also ran an experiment in E. coli with 13C-labelled glucose and carbon starvation to compare metabolomes, by running samples from labeled/starved with unlabelled/unstarved and labeled/unstarved with labeled/starved, they could determine intensity differences.


Some side notes:
- Cellular metabolites make up less than 3% of dry cell weight in E. coli
- Gas chromatography is good for low-weight, but not for low volatility and thermal stability (such as phosphates)
- Metabolites sensitive to environmental change, 39 significantly changed between conditions, notably FBP and IMP
- Reverse Phase Chromatography: non-polar nonmobile/polar mobile phase, compounds that have more surface area to interact with nonpolar elute later (nonbranched, saturated)
- HILIC: Hydrophilic Interaction Chromatography: polar nonmobile/nonpolar mobile, aqueous layer around nonmobile which grabs hold of polar analytes


This paper is relatively straightforward, a good layout of another column type to use to capture more metabolites accurately and expand the abilities of mass spectrometry to further metabolomics. A good, brief experiment comparing compound levels between two growth-types of E. coli.

Monday, August 18, 2008

Histone Modification Patterns in Human Genome

Source: Wang et al. (2008). Combinatorial patterns of histone acetylations and methylations in the human genome. Nature Genetics 40:897-903.

Histone modification is one of the strategies employed by the eukaryotic systems to regulate their gene expression. For example, histone acetylation acts as an activator; whereas, methylation (depending on the site) can both be a repressor and activator. The "histone code hypothesis" states that a combination of histome modifications acts as an indicator of the chromatin state. Using ChIp-Seq technique, the authors make genome-wide maps for 18 different acetylations and 19 different methylations. Their results adds fascinating knowledge to our understanding of histone modifications. For example, they find a positive correlation between acetylation sites and expression, as previously known, but they show spacial arrangements for different types of acetylation. Some of these modifications are focused on TSS (transcription start site); whereas, others are in promoters or even in the gene itself.

Of the 4339 combinatorial patterns observed by the authors, most occur only once. 13 of these patterns, being the most frequent ones, are located in more than 62 genes each. Comparing the presence of these patterens with gene-expression data, the authors have classified the patterns into three distinct groups:
1. Low expression: High occurrence of H3K27me3 modification and other methylations but not acetylation.
2. Average expression: Generally including backbone modifications.
3. High expression: H2BK5me1, H4K16ac, H4K20me1 and H3K79me1/2/3 in addition to the modification
backbone.

I won't detail all the observations but they also report distinct histon modification patterns at enhancer sites.

Friday, August 15, 2008

Identifying Unknown Metabolic Genes

Source: Allen, J., Davey, H.M., Broadhurst, D., Heald, J.K., Rowland, J.J., Oliver, S.G., and Kell, D.B. (2003) High-throughput classification of yeast mutants for functional genomics using metabolic footprinting. Nature Biotechnology, 21(6): 692-6


Gene deletion strains of yeast were grown up in media, and the media was taken out at specific time points for mass-spec analysis. By measuring extracellular metabolites (footprinting), they were able to more quickly and easily get an idea on cellular metabolism. The authors then used discriminate function analysis and principal components analysis to map out the metabolomes of their strains and discover grouping according to gene-deletion. This was an effective way to classify unknown gene deletions, observing through ‘guilt-by-association’ which groups they fell in and thus what the gene most likely encoded.


Some side notes:
-Fingerprinting: measuring intracellular metabolites
-Footprinting: measuring extracellular metabolites
-“Yet the metabolome…should show greater effects of genetic or physiological changes and thus should be much closer to the phenotype of the organism.”
-Marked changes in metabolome between log-phase and stationary phase growth
-Discriminant Functional Analysis: Using multiple variables to determine group membership. Usually trained on a set where both membership and variables are known, then used on samples where only variables are known to derive membership.
-Mutants could be distinguished based on footprinting


I found this to be simple, understandable high-throughput approach, but with some serious failings. It is easy to conceive of a gene-deletion having a downstream metabolic effect, classifying it by such an effect may mask it's true purpose. Proteins that are involved in the same functional pathway, yet at grossly different points, may be grouped falsely; though they would at least be correctly assigned to the same function. As a springboard toward verification and a method to narrow down candidate genes, this database will have its uses.

Thursday, August 14, 2008

mRNA Self-cleavage: Another Strategy for Gene Expression Regulation

Source: Martick et al. (2008). A discontinuous hammerhead ribozyme embedded in a mammalian messenger RNA. Nature 454:899-902.

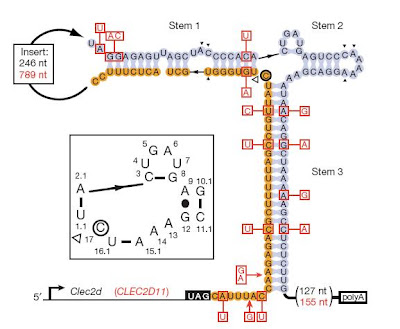
Hammerhead ribozyme
is an RNA with catalytic activity which is capable of self-cleavage. The authors, attest the hypothesis that ribozymed may reside in mRNA and thus control the stability of the mRNA through auto-catalytic self-cleavage. They found three occurrences of hammerhead ribozyme in rodent 3' UTRs; Clec2d and Clec2e (which are paralogs) and Clec2d11 (a homolog of Clec2d). Subsequent homology searches succeeded in finding homologs of these genes in other mammals as well (e.g. horse and platypus). Below you see the general secondary structure of these embeded ribozymes.


Using the Clec2d and Clec2e in vitro transcription, the authors showed that cleavage takes place at the predicted sites; whereas, in transcripts with a mutant ribozyme the transcript stays intact. They also used reporter constructs to test the expression level of lucipherase gene in the presence and absence of this ribozyme in its 3' UTR. They showed that addition of this ribozyme downregulates the transcript level.

Overall, this is a very intersting paper introducing a new strategy for gene regulation. I guess there are many more of these mechanisms are waiting to be found. However, these strategies, as elegant as they are, are far from universal.

Tuesday, August 12, 2008

Modeling Chaos: A Long-term Study of a Mesocosm

Source: Beninca et al (2008). Chaos in a long-term experiment with a plankton community. Nature 451:822-825.

Ecological systems are chaotic in nature. Theoretically, this chaos can emerge from competition, predator-prey interactions and food-chain dynamics. Empirical data, however, is scarce mainly due to the inherent complication of disentangling the external variables (e.g. weather) from intrinsic interactions. In this study, the authors study a complex planktonic community for the first time. This community was cultured in a controlled microcosm with constant external conditions for more than eight ye
ars. The species in this community (along with the food-web structure) are given in the figure below.


These species were counted twice a week for 2319 days (690 data points). These data points very well capture the correlations originating from competition, predator-prey or even mutualism interactions in the community. These results show that species interactions can create significant fluctuations in the population of each species. In addition, they showed that while in short term the system was predictable, exceeding 15 days significantly decreased predictability. This abrupt decrease is a marker for chaos.

In sum, this small community shows signatures of chaos through fluctuations in the abundance of species.

Friday, August 8, 2008

Regulation by Exile: How a Transcription Factor Regulates A Secretion System

Source: Raghavan et al (2008). Secreted transcription factor controls Mycobacterium tuberculosis virulence. Nature 454:717-721.

M. tuberculosis relies on a Type VII secretion system, termed ESX-1, to export the virulence factors targeting the host macrophages. In a transposon mutation genetic screen, the authors stumbled upon a mutant with elevated levels of IL-12 from macrophages (a common trait of ESX-1 mutants). They map the insertion to 13 nt upstream of Rv3849 which they later renames EspR. They made two other key observations:
  1. EspR is a substrate of ESX-1, thus exported from the cell.
  2. EspR is required for the transcription regulation of ESX-1.
The authors established a homology between EspR and SinR (a HTH transcription factor in B. subtilis). Subsequent microarray experiments showed that EspR regulates ESX-1 proteins. The conclusion is ESX-1 by exporting EspR creates a negative feedback loop for the control of its expression.

Thursday, August 7, 2008

Complexity vs. Evolovability: The Role of Pleiotropy in Evolution

Source: Wagner et al. (2008). Pleiotropic scaling of gene effects and the 'cost of complexity'. Nature 452: 470-472.

There is a intuitive notion among the biologists which indicates that complexity decreases evolvability mostly due to the pleiotropic effects. The bottom line is that a mutation in a complex organism results in more drastic changes (both in quantity and quality). The authors of this paper challenge this point of view through studying the quantitative trait loci in a set of inbred mice. Their studied traits comprise a set of skeletal variables and phenotypes. The authors show that while there is a positive correlation between the magnitude of the effects and the number of traits affected (N), N is a very small number compared to what is generally thought. When we talk about the cost of complexity, we think that each mutation can potentially affect all the phenotypes through direct or indirect effects. However, evolution can control this through enforcing modularity. In a modular system, mutations in each subset has little effects on the system as whole. In other words, robustness and modularity decrease the cost of complexity.

Friday, August 1, 2008

The Symbiotic Microbiome in Charge of Training the Immune System

Source: Mazmanian et al (2008). A microbial symbiosis factor prevents intestinal inflammatory disease. Nature 453:620-625.

In general, reduced exposure to infectious agents throughout childhood increases the chance of allergic and auto-immune disease. Improvements in personal hygiene and the rampant use of antibiotics have direly affected our associations with our symbiotic microbiome. This paper is a very good example of such deregulations where the authors name the absence of Bacteroides fragilis as a cause for the emergence of colitis and other IBDs.

Here, the authors have shown that B. fragilis is essential for protection against colitis. Their experiments involves testing the germ-free mice grown in sterile conditions. Apparently, the presence of
B. fragilis in the intestine switches the uneducated T cells (CD4+ CD45Rbhigh) to educated T cells (CD4+ CD45Rblow) that possess significant anti-inflammatory properties. B. fragilis affects the immune system through the production of PSA (polysaccharide A). ΔPSA strains lose their protective ability. PSA induces IL-10 expression in the intestine which is a potent anti-inflammatory agent.

We should utterly remember that
B. fragilis is only one of the thousand symbiotic bacteria. Evolutionary interactions may have very well shaped our symbiotic bacterium as an often-forgotten organ.

Thursday, July 31, 2008

RNA-seq: Dynamic Changes in the Transcriptome of Fission Yeast

Source: Wilhelm et al (2008). Dynamic repertoire of a eukaryotic transcriptome surveyed at single-nucleotide resolution. Nature 453:1239-1243.

The authors of this paper employ massive RNA-seq strategies to extract transcriptome data from S. pombe in several conditions (i.e. proliferation, stress, meiosis and etc). First they mke the case for the sensitivity of RNA-seq in finding the expressed regions that do not show up in tiling array hybridizations. Their first observation is that a major proportion of the genome, although to various extents, is expressed. They have subsequently identified ~80 new genes with detectable transcripts. These transcripts, however, are degraded before being exported from the nucleus; thus, highlighting the role of post-transcriptional degraders and regulators. This paper includes many details about the detectable regions and the dynamics of splicing that I didn't mention. If you're working on fission yeast, I strongly suggest this paper.

Tuesday, July 29, 2008

Mapping Gene-conversion During Meiosis

Source: Mancera et al (2008). High-resolution mapping of meiotic crossovers and non-crossovers in yeast. Nature 454(24):479-485.

The strict linkage between the genes on a chromos
ome is broken through recombination. In addition to its evolutionary significance, meiosis crossovers also facilitate chromosome segregation. Gene conversion happens either through crossovers (which involves reciprocal exchange of strands) or non-crossover events (through synthesis-dependent strand annealing). In this paper, the authors have presented a high-resolution map of these events. The method (shown in the figure below) involves high-resolution genotyping of all the four viable spores from the meiosis event.


Then, they use the genotyping data to find both crossover and non-crossover conversions (Part b of the figure above from the original paper). The resulting map can be probed for the identification of recombination hotspots. The reported hotspots in this study include almost all of the previously known regions. Interestingly, crossover and non-crossover events have distince distributions with different hotspots.

The authors also test recombination methods to elucidate the role of different pathways in the obsereved deregulations. In the end, they also make an interesting case for interference and how crossover and non-crossover events also show spatial avoidance.

Sunday, July 27, 2008

Fine-tuning Transcription Level: Differential Expression of Genes in an Operon

Source: Pfleger et al (2006). Combinatorial engineering of intergenic regions in operons tunes expression of multiple genes. Nat Biotech 24(8):1027-1032.

Coordinated expression of genes active in a pathway or a protein complex is very important with respect to maximizing output and minimizing toxic intermediate com
punds. In prokaryotes, related genes are clustered in operons and further fine-tuned through intergenic sequences (e.g. premature termination or RBS masking). While evolution has taken care of endogenous pathways, we have a hard time achieving such an optimality with engineered pathways. In this paper, the authors generate a library of random intergenic regions (which they call TIGRs). These TIGRs may include random hair-pin sites or RNase E sites. They initially test these TIGR libraries on an operon with RFP and GFP genes (see the figure below from the original paper). Screening this library shows a range of both absolute and relative expression levels for these two genes. For example, they show that in regions where the RBS for the second gene is captured in a stem-loop structure the expression of the second gene is drastically reduced. The same holds for the cases where the hair-pin structures prematurely terminate transcription.


Upon making the case for the applicability of their method, they employ it for optimizing an exogenousy introduced mevalonate pathway in E. coli which includes an operon of three genes. Upon screening for higher mevalonate production, the authors identify constructs with upto a seven-fold increase in production.

Friday, July 25, 2008

Protein Binding Microarrays: Finding Transcrition Factor Binding Sites

Source: Berger et al (2006). Compact, universal DNA microarrays to comprehensively determine transcription-factor binding site specificities. Nat Biotech 24(11):1429-1435.

When I published a synopsis from Erandi on discovering AP2 binding sites in P. falciparum, I knew at some point I have to write about PBMs.
De Silva et al. (2008) have used this ingenious method and apparently it works. The basic idea is that in many cases, we have identified a putative transcription factor and we are interested in finding its binding site (and subsequently identifying its potential targets). This method starts by the purification of an epitope-tagged version of our protein which is then hybridized to a microarray slide harboring all possible k-mers of a given length (e.g. 10-mers). Upon washing away the non-specific interactions, a fluorophore-conjugated antibody (against the epitope-tag) is used to find the spots containing protein-DNA interactions. The final step involves overlapping the bound oligos and finding the consensus binding sequence.

As you see, the theory is simple; however, making the PBM is not trivial given the space of all possible sequences. Below, I have attached a figure from the original paper demonstrating this method. First, they use the notion of de Bruijn sequences to minimize the number of spots needed to represent all possible k-mers. Upon synthesizing these oligos on a slide, they convert them to dsDNA (Cy3 labeled dUTP) using a Cy5 labeled
universal primer. The labels are used to ensure that the reactions are in fact completed. An Alexa488-conjugated GST antibody is then used to identify the proteins bound to these features.


Thursday, July 24, 2008

Revealing the Chromatin Structure of Human Promoters

Source: Ozsolak et al. (2007). High-throughput mapping of the chromatin structure of human promoters. Nat Biotech 25(2):244-248.

There are many models surrounding the effects of chromatin remodeling and how it affects the genetic context in which the genes are transcribed and expressed. However, without a precise map of where the nucleosomes are, we cannot tell whether they are remodeled or not given a certain stimulus. This paper represents a series of similar studies using tiling arrays (or more recently high-throughput sequencing) to find the nucleosome positionings. Subjecting nucleosome-bound DNA to micrococcal nuclease (MNase) will result in the degradation of the linker fragments while the bound segments will be protected by the histones. In theory, finding the sequence of the fragments surviving MNase should give us the nucleosome positions in the genome. Tiling arrays are suitable for this purpose, helping us to find the parts of the genome that remains intact after digestion.

In practice, the data is way noisier than we might assume due to many reasons (e.g. DNA bound to proteins other than nucleosomes or simply shortcomings in the technical methods). The significance of this paper is in developing computational methods for cancelling out the noise and improving the signal to noise ratio. They effectively succeed in recapitulating the nucleosome positionings that are already known in case of certain promoters (e.g. see the figure below).


Upon mapping the nucleosome positions, the authors proceed to make useful observations. For example, they show that in the highly expressed genes, the promoter region is stripped off the nucleosomes. They also make the case that certain binding elements fall outside of nucleosome-bound region, meaning they are probably bound by active transcription factors.

Monday, July 21, 2008

Coding the Genetic Code: Evolved Ribosomes with Enhanced Capacity in the Expansion of Genetic Code

Source: Wang et al. (2007). Evolved orthogonal ribosomes enhance the efficiency of synthetic genetic code expansion. Nat biotech 25(7):770-777.

The canonical genetic code can be expanded... it includes the incorporation of an unnatural amino acid into a target protein through assignment of a stop codon (e.g.
the amber site UAG). Although this has been done (and in some sense has revolutionized biotechnology), there are major obstacles in the way of achieving a high level of incorporation especially in cases where there are more than one occurences of the unnatural codon in the coding sequence. This is in turn due to the competitive activity of the RF-1 protein which terminates translation upon recognition of the amber sites. Evidently, RF-1 is an essential gene and knocking it out is not an option. The authors in this paper come up with a decent idea for circumventing RF-1.

Genetic code expansion is achieved through introduction of an orthogonal tRNA and AA-tRNA synthetase; orthogonal in the sense that the natural AA-tRNA synthetases don't charge the introduced tRNA and the orthogonal AA-tRNA synthetase does not recognize any other tRNAs. In this paper, Wang et al. have taken this notion one step further: introducing an orthogonal ribosome which is unique for translating the target RNA and doesn't bind RF-1. They evolve such ribosome through mutagenizing 16S rRNA and then selecting for a clone that can efficiently read through an amber mutation in order to grow on chloramphenicole (see the figure below). In the rest of the paper, they attempt to validate the activity of this ribosome (which the call Ribo-X).