Friday, August 29, 2008

The Next Locus is Always Harder

Source: Brem, R.B., Storey, J.D., Whittle, J., and Kruglyak, L. Genetic interactions between polymorphisms that affect gene expression in yeast. 2005. Nature, 436(7051): 701-3

The authors took the transcript data for yeast and searched for interacting loci. They found that the best approach was to search for primary loci, then separate segregants based on allele inherited at that locus and search jointly for another locus. Using this approach, they found that not a large amount of transcripts had detectable interactions and those that did were isolated. One hotspot did appear for loci-pairs, the MAT-GPA relation, these genes are involved in mating type and pheromone response respectively. They used this hotspot to test their interaction theory, creating four engineered strains with the combination of alleles, but identical background, and comparing them to similar-genotyped segregants, finding that most of the phenotypes had parallel responses.

•Other notes:
-identified locus pairings for 225 transcripts
-65% had interaction based on model and FDR
•test on 547 transcripts with two independent loci showed only 13% interacting
-only 33% of secondary loci would have been picked up in a genome scan originally
-hypothesize that half of transcripts are controlled by multiple genetic interactions but that at least one partner has effects too low for mapping


Dual-linking transcripts are plotted in 2-D, with their primary linkage locus on the x-axis, and their secondary on the y-axis. Circles are proportional (in misleading width, NOT area) by the number of transcripts in each 2-D bin. The largest is the GPA-MAT region.

Thursday, August 28, 2008

Small Phenotypes - Large Number of Loci

Source: Brem, R.B. and Kruglyak, L. The landscape of genetic complexity across 5,700 gene expression traits in yeast. 2005. PNAS, 102 (5): 1572-7

The authors measured transcript abundance between BY4716 and RM11-1a yeast strains as well as their segregants to do QTL mapping. Over half the transcripts linked to a QTL, but extensive modeling showed that most traits would have multiple loci and no single locus would have a large effect. The authors limited the transcripts they looked at based on heritability scores. They also did a breakdown of inheritance patterns for the phenotypes and concluded that an overwhelming proportion are inherited in a transgressive segregation manner as compared to an additive effect. A small but nontrivial were found to be epistatically inherited, and most were in the transgressive segregation camp.

Other notes:
-median heritability was 27%
-no QTLs detected for nearly 40% of highly heritable transcripts
-only 3% of highly heritable transcripts have single-locus inheritance, 17-18% for one or two loci, over half for at least five loci
-11% had directional model (phenotype of one parent)
-59% were transgressive segregation (outside parental range)
-16% epistatic (tests difference between means of segregants and parents)
-“opposing QTLs may be a mechanism for generating diversity in subsequent generations”


Left: Directional; Center: Transgressive; Right: Epistatic


Damn you genetic complexity!

Wednesday, August 27, 2008

Discovering microRNA–target RNA pairs

Source: German et al. (2008). Global identification of microRNA–target RNA pairs by parallel analysis of RNA ends. Nature Biotech 26:941-946.

The authors have introduced a great method for identifying miRNA target sites through sequencing the 3' cleavage fragments and finding their potential miRNAs. The schematics of their method is shown below where they ligate a linker to the 3' cleavage fragments. Normal mRNAs would not be ligated due to the presence of a cap or lack of 5' phosphate. They subsequently amplify and sequence the ligated fragments. Their library has a great coverage and encompasses ~90% of the orfs in yeast. Their method captures 98 out 100 known miRNA target sites in arabidopsis. This batch of sequenced target sites were then used to identify the corresponding miRNA. They validate a set of their prediction which seems to work fine.

Tuesday, August 26, 2008

Good-bye stress response

Source: Brauer, M.J., Huttenhower, C., Airoldi, E.M., Rosenstein, R., Matese, J.C., Gresham, D., Boer, V.M., Troyanskaya, O.G., and Botstein, D. Coordination of growth rate, cell cycle, stress response, and metabolic activity in yeast. 2008. Molecular Biology of the Cell, 19: 352-67

The authors ran 36 samples (6 growth rates on 6 nutrient limitations, including two auxotrophs) and measured global transcript levels at and steady-stage growth. They looked to see if gene expression could be a linearly correlated with growth rate and found that for 27% of genes, this appeared to be the case. Auxotrophs limited for phosphate or nitrogen showed cell arrest and normal levels of glucose and ethanol in the media, but when limited for their auxotrophy showed high fermentation with greatly enhanced levels of ethanol present. The authors hypothesize that there are two metabolic controls: one that’s independent of nutrient type, limits based on cell growth without full arrest while the other senses a natural nutrient starvation and fully arrests the cell. The authors also compare their gene sets of positively and negatively correlated genes to gene sets from stress response, cell cycle periodicity and yeast metabolic cycle periodicity. They find that most of the genes positively correlated with growth rate are found in stress repressed conditions and mitochondrial and cytosolic ribosome clusters from YMC. While genes negatively correlated to growth rate are found in stress induced and peroxisomal clusters from YMC. They suggest that these genes are mainly responding to instantaneous growth rates and not the particular condition tested. Building a model off this presumption, they are able to more-or-less recreate the growth rate from transcript data from Brauer et al 2005 involving the diauxic shift. Much of their significance for whether a gene is positively or negatively-correlated with growth comes from bootstrapping.


Figure 5. Transcriptional response of stress-related and cell cycle-related genes to changes in growth rate. x-axis: Slope of transcript abudance vs growth. Genes expressed periodically during the cell cycle (black line; Spellman et al., 1998) are distributed essentially as background, whereas genes induced (red line) or repressed (green line) by stress (Gasch et al., 2000) tend to be conversely repressed or induced as growth rate increases.

• Other notes:
-positively-correlated genes are enriched for ribosomal proteins
-auxotrophs don’t arrest when lacking their auxotrophic nutrient, but do when lacking a natural nutrient; also consume twice as much glucose
-5537 genes measured, 3049 fit linear model with growth rate, 1470 respond significantly to growth rate
-can play with sets of genes at http://growthrate.princeton.edu
=GO enrichment – negative: energy metabolism, oxidative metabolism, oxioreductase activity, peroxisome
=positive: mitochondrial protein import, translation, ribosome biogenesis, rRNA metabolism
-ESR genes may be responding not to stress but to instantaneous growth rate
-cell-cycle genes had same distribution as total gene set
=only M-G1 phase was slightly enriched for negative correlation with growth rate
•slower growing cells spend more time waiting for division signal
-yeast grown in batch on poorer nutrient sources had better stress response
=this supports the theory that ESR-induced genes are just slow-rate genes, these cells were already growing slowly so they did not change as dramatically

Although I find it intriguing to think that transcript abundance is more a response to growth rate than stress, I find some problems with that interpretation. Slower growing cells, goes the hypothesis, will respond better to stress since they already have the right transcript profile. BUT, slower growing cells spend a greater proportion of their life in G1 and G2, the energy-producing stages. This means they are already subject to more stress per cell cycle, and thus that is the reason the Stress/Slow Growth profile is already up. In the end, maybe it's semantics unless we can start to find stress-specific profiles.

Monday, August 25, 2008

How harmful are amino acid changes?

Source: Boyko, A.R., Williamson, S.H., Indap, A.R., Degenhardt, J.D., Hernandez, R.D., Lohmueller, K.E., Adams, M.D., Schmidt, S., Sninsky, J.J., Sunyaev, S.R., White, T.J., Nielsen, R., Clark, A.G., and Bustamante, C.D. Assessing the evolutionary impact of amino acid mutations in the human genome. 2008. PLoS Genetics, 4(5):e1000083

Its well-known that amino acids aren't necessarily well-conserved in homologous proteins, but function will remain. Obviously some amino acids can easily substitute in for others to fulfill some structure or charge function. So what happens when a SNP comes along and alter an amino acid? Usually, nothing, or at most a slight decrease in stability.

The authors scanned the human genome of a small sample of African and European Americans, looking for SNPs, allele frequency, and the amount of change each SNP may cause. They found that many nonsynonymous mutations are neutral (27-29%), a large amount are slightly deleterious (30-42%), and the rest are highly deleterious or lethal. Most of the highly deleterious alleles were present in alleles that were less than 5% of sampled alleles at that locus. Additionally, the cumulative affect of benign mutations greatly outweighed the effect of harmful mutations. The affect of SNPs was measured using PolyPhen, a program that characterized the SNP as benign, possibly damaging, and probably damaging based on its conservation and amino acid change; ‘damaging’ only referring to protein structure not organisms’ fitness. Furthermore, comparing to an outgroup of chimpanzees, 10-20% of SNPs were deemed fixed by positive selection.


Allele frequency on x-axis

Red: strongly deleterious
Orange: moderately
Yellow: weakly
Green: nearly neutral
Blue: neutral
White: beneficial

Other notes:
-around half of nonsynonymous mutations are strongly or mildly deleterious
-most segregating variation above 5% frequency in the population is predicted to be nearly neutral, with higher proportion of neutral variation as the allele frequency increases
-15,916 benign; 4,199 possibly damaging; 2,646 probably damaging SNPs from PolyPhen
-estimated 5% of benign, 27% of possibly, and 35% of probably damaging were fixed through positive selection

Thursday, August 21, 2008

RNA-Seq: Deep Sequencing the Human Transcriptome

Source: Sultan et al. (2008). A Global View of Gene Activity and Alternative Splicing by Deep Sequencing of the Human Transcriptome. Science 321:956-960.

Apparently, we're going back to re-doing all the experiments that we once did using tiling arrays. These papers are far from innovative but I think it's good for the people in the field to know that this data is out there (hence supporing its publication in science). Apart from expensive reactions, tiling arrays also miss vital information like splice sites and alternative splicing. RNA-seq circumvents most of the problems inherent to other methods and the authors have used this approach to provide snapshots of hum
an transcriptome at the nucleotide level. The authors do many controls to validate their results. For example, they compare the reads for each gene to PolII Chip-seq data to make the case that the number of reads is a good measure for expression. The figure below (from the original paper) shows the distribution of PolII Chip-seq reads for the genes with different levels of expression (the x-asis is the position relative to TSS).


Their results generally include the identification 25% more genes and ~100, 000 splice sites (compared to ~4000 known before). They also show that exon skipping is the most prevalent method of splicing.

Metabolic Flux and Sequence Conservation

Source: Bilu, Y., Shlomi, T., Barkai, N., and Ruppin, E. Conservation of expression and sequence of metabolic genes is reflected by activity across metabolic states. 2006. PLoS Computational Biology, 2(8):e106

The authors use flux balance analysis (FBA) to create an optimal solution set for metabolic genes in various media conditions. They then compare the flux in this set for individual reactions to evolution rate of the protein-coding region, promoter, and expression levels. The authors found rough correlation in the expected manner: lower flux variability genes show higher conservation across species. Additionally, genes found to be active throughout different media conditions were found to be well conserved.

Other notes
-in FBA’s optimal solution space there are missing constraints to the model, though it has been shown that models still carry meaningful biological info
-flux values show moderate, statistically significant correlation with corresponding gene expression levels and protein abundance
-flux variability analysis: difference between max and min flux values in the space of optimal flux distributions for each reaction
-expression divergence score: expression patterns among four yeast strains
-promoter conservation score: based on three yeast species’ conservation of S. cerevisiae transcription factor binding sites
-moderate, statistically significant correlation between flexibility scores and expression divergence score, promoter conservation score
-possible that high flexibility score means the genes are in pathways that have alternatives
-of the 50 genes with highest flex score, 6% are essential, whereas 17% of the 89 zero-flex genes are essential
-statistically significant correlation between knockout growth rate (For metabolic genes) and evolutionary rate
-best predictor for evolutionary rate is the expression level of the encoded gene
-“Previous studies suggest that the predicted variability in metabolic states may represent heterogeneous metabolic behaviors of individuals within a cell population”


I found this study short and sweet. A simple question: Do highly conserved genes have more rigid optimum activities? So for enzymes that are not metabolically constrained we see a greater diversity in sequence. This makes senses, mess with the choke-points and you screw up a pathway, tinker with some of the non rate-limiting genes and there isn't as much a problem.

Tuesday, August 19, 2008

Liquid Chromatography : A Pivotal First Step in Compound Measurement

Source: Bajad, S.U., Lu, W., Kimball, E.H., Yuan, J., Peterson, C., and Rabinowitz, J.D. (2006) Separation and quantitation of water soluble cellular metabolites by hydrophilic interaction chromatography-tandem mass spectrometry. Journal of Chromatography A, 1125, 76 – 88.

My labmates tried a number of different columns in a number of different conditions to settle on HILIC with amino column at pH of 9 for best results. They did this testing a number of spiked in compounds and using a derived scoring method to analyze peak ‘goodness.’ After settling on this, they discovered retention times to improve the scan method and were able to quantitate over 100 metabolites. They also ran an experiment in E. coli with 13C-labelled glucose and carbon starvation to compare metabolomes, by running samples from labeled/starved with unlabelled/unstarved and labeled/unstarved with labeled/starved, they could determine intensity differences.


Some side notes:
- Cellular metabolites make up less than 3% of dry cell weight in E. coli
- Gas chromatography is good for low-weight, but not for low volatility and thermal stability (such as phosphates)
- Metabolites sensitive to environmental change, 39 significantly changed between conditions, notably FBP and IMP
- Reverse Phase Chromatography: non-polar nonmobile/polar mobile phase, compounds that have more surface area to interact with nonpolar elute later (nonbranched, saturated)
- HILIC: Hydrophilic Interaction Chromatography: polar nonmobile/nonpolar mobile, aqueous layer around nonmobile which grabs hold of polar analytes


This paper is relatively straightforward, a good layout of another column type to use to capture more metabolites accurately and expand the abilities of mass spectrometry to further metabolomics. A good, brief experiment comparing compound levels between two growth-types of E. coli.

Monday, August 18, 2008

Histone Modification Patterns in Human Genome

Source: Wang et al. (2008). Combinatorial patterns of histone acetylations and methylations in the human genome. Nature Genetics 40:897-903.

Histone modification is one of the strategies employed by the eukaryotic systems to regulate their gene expression. For example, histone acetylation acts as an activator; whereas, methylation (depending on the site) can both be a repressor and activator. The "histone code hypothesis" states that a combination of histome modifications acts as an indicator of the chromatin state. Using ChIp-Seq technique, the authors make genome-wide maps for 18 different acetylations and 19 different methylations. Their results adds fascinating knowledge to our understanding of histone modifications. For example, they find a positive correlation between acetylation sites and expression, as previously known, but they show spacial arrangements for different types of acetylation. Some of these modifications are focused on TSS (transcription start site); whereas, others are in promoters or even in the gene itself.

Of the 4339 combinatorial patterns observed by the authors, most occur only once. 13 of these patterns, being the most frequent ones, are located in more than 62 genes each. Comparing the presence of these patterens with gene-expression data, the authors have classified the patterns into three distinct groups:
1. Low expression: High occurrence of H3K27me3 modification and other methylations but not acetylation.
2. Average expression: Generally including backbone modifications.
3. High expression: H2BK5me1, H4K16ac, H4K20me1 and H3K79me1/2/3 in addition to the modification
backbone.

I won't detail all the observations but they also report distinct histon modification patterns at enhancer sites.

Friday, August 15, 2008

Identifying Unknown Metabolic Genes

Source: Allen, J., Davey, H.M., Broadhurst, D., Heald, J.K., Rowland, J.J., Oliver, S.G., and Kell, D.B. (2003) High-throughput classification of yeast mutants for functional genomics using metabolic footprinting. Nature Biotechnology, 21(6): 692-6


Gene deletion strains of yeast were grown up in media, and the media was taken out at specific time points for mass-spec analysis. By measuring extracellular metabolites (footprinting), they were able to more quickly and easily get an idea on cellular metabolism. The authors then used discriminate function analysis and principal components analysis to map out the metabolomes of their strains and discover grouping according to gene-deletion. This was an effective way to classify unknown gene deletions, observing through ‘guilt-by-association’ which groups they fell in and thus what the gene most likely encoded.


Some side notes:
-Fingerprinting: measuring intracellular metabolites
-Footprinting: measuring extracellular metabolites
-“Yet the metabolome…should show greater effects of genetic or physiological changes and thus should be much closer to the phenotype of the organism.”
-Marked changes in metabolome between log-phase and stationary phase growth
-Discriminant Functional Analysis: Using multiple variables to determine group membership. Usually trained on a set where both membership and variables are known, then used on samples where only variables are known to derive membership.
-Mutants could be distinguished based on footprinting


I found this to be simple, understandable high-throughput approach, but with some serious failings. It is easy to conceive of a gene-deletion having a downstream metabolic effect, classifying it by such an effect may mask it's true purpose. Proteins that are involved in the same functional pathway, yet at grossly different points, may be grouped falsely; though they would at least be correctly assigned to the same function. As a springboard toward verification and a method to narrow down candidate genes, this database will have its uses.

Thursday, August 14, 2008

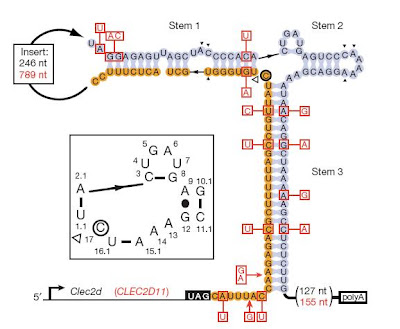
mRNA Self-cleavage: Another Strategy for Gene Expression Regulation

Source: Martick et al. (2008). A discontinuous hammerhead ribozyme embedded in a mammalian messenger RNA. Nature 454:899-902.

Hammerhead ribozyme
is an RNA with catalytic activity which is capable of self-cleavage. The authors, attest the hypothesis that ribozymed may reside in mRNA and thus control the stability of the mRNA through auto-catalytic self-cleavage. They found three occurrences of hammerhead ribozyme in rodent 3' UTRs; Clec2d and Clec2e (which are paralogs) and Clec2d11 (a homolog of Clec2d). Subsequent homology searches succeeded in finding homologs of these genes in other mammals as well (e.g. horse and platypus). Below you see the general secondary structure of these embeded ribozymes.


Using the Clec2d and Clec2e in vitro transcription, the authors showed that cleavage takes place at the predicted sites; whereas, in transcripts with a mutant ribozyme the transcript stays intact. They also used reporter constructs to test the expression level of lucipherase gene in the presence and absence of this ribozyme in its 3' UTR. They showed that addition of this ribozyme downregulates the transcript level.

Overall, this is a very intersting paper introducing a new strategy for gene regulation. I guess there are many more of these mechanisms are waiting to be found. However, these strategies, as elegant as they are, are far from universal.

Tuesday, August 12, 2008

Modeling Chaos: A Long-term Study of a Mesocosm

Source: Beninca et al (2008). Chaos in a long-term experiment with a plankton community. Nature 451:822-825.

Ecological systems are chaotic in nature. Theoretically, this chaos can emerge from competition, predator-prey interactions and food-chain dynamics. Empirical data, however, is scarce mainly due to the inherent complication of disentangling the external variables (e.g. weather) from intrinsic interactions. In this study, the authors study a complex planktonic community for the first time. This community was cultured in a controlled microcosm with constant external conditions for more than eight ye
ars. The species in this community (along with the food-web structure) are given in the figure below.


These species were counted twice a week for 2319 days (690 data points). These data points very well capture the correlations originating from competition, predator-prey or even mutualism interactions in the community. These results show that species interactions can create significant fluctuations in the population of each species. In addition, they showed that while in short term the system was predictable, exceeding 15 days significantly decreased predictability. This abrupt decrease is a marker for chaos.

In sum, this small community shows signatures of chaos through fluctuations in the abundance of species.

Friday, August 8, 2008

Regulation by Exile: How a Transcription Factor Regulates A Secretion System

Source: Raghavan et al (2008). Secreted transcription factor controls Mycobacterium tuberculosis virulence. Nature 454:717-721.

M. tuberculosis relies on a Type VII secretion system, termed ESX-1, to export the virulence factors targeting the host macrophages. In a transposon mutation genetic screen, the authors stumbled upon a mutant with elevated levels of IL-12 from macrophages (a common trait of ESX-1 mutants). They map the insertion to 13 nt upstream of Rv3849 which they later renames EspR. They made two other key observations:
  1. EspR is a substrate of ESX-1, thus exported from the cell.
  2. EspR is required for the transcription regulation of ESX-1.
The authors established a homology between EspR and SinR (a HTH transcription factor in B. subtilis). Subsequent microarray experiments showed that EspR regulates ESX-1 proteins. The conclusion is ESX-1 by exporting EspR creates a negative feedback loop for the control of its expression.

Thursday, August 7, 2008

Complexity vs. Evolovability: The Role of Pleiotropy in Evolution

Source: Wagner et al. (2008). Pleiotropic scaling of gene effects and the 'cost of complexity'. Nature 452: 470-472.

There is a intuitive notion among the biologists which indicates that complexity decreases evolvability mostly due to the pleiotropic effects. The bottom line is that a mutation in a complex organism results in more drastic changes (both in quantity and quality). The authors of this paper challenge this point of view through studying the quantitative trait loci in a set of inbred mice. Their studied traits comprise a set of skeletal variables and phenotypes. The authors show that while there is a positive correlation between the magnitude of the effects and the number of traits affected (N), N is a very small number compared to what is generally thought. When we talk about the cost of complexity, we think that each mutation can potentially affect all the phenotypes through direct or indirect effects. However, evolution can control this through enforcing modularity. In a modular system, mutations in each subset has little effects on the system as whole. In other words, robustness and modularity decrease the cost of complexity.

Friday, August 1, 2008

The Symbiotic Microbiome in Charge of Training the Immune System

Source: Mazmanian et al (2008). A microbial symbiosis factor prevents intestinal inflammatory disease. Nature 453:620-625.

In general, reduced exposure to infectious agents throughout childhood increases the chance of allergic and auto-immune disease. Improvements in personal hygiene and the rampant use of antibiotics have direly affected our associations with our symbiotic microbiome. This paper is a very good example of such deregulations where the authors name the absence of Bacteroides fragilis as a cause for the emergence of colitis and other IBDs.

Here, the authors have shown that B. fragilis is essential for protection against colitis. Their experiments involves testing the germ-free mice grown in sterile conditions. Apparently, the presence of
B. fragilis in the intestine switches the uneducated T cells (CD4+ CD45Rbhigh) to educated T cells (CD4+ CD45Rblow) that possess significant anti-inflammatory properties. B. fragilis affects the immune system through the production of PSA (polysaccharide A). ΔPSA strains lose their protective ability. PSA induces IL-10 expression in the intestine which is a potent anti-inflammatory agent.

We should utterly remember that
B. fragilis is only one of the thousand symbiotic bacteria. Evolutionary interactions may have very well shaped our symbiotic bacterium as an often-forgotten organ.